Severe Tropical Cyclone Orson was the fourth most intense cyclone ever recorded in the Australian region.[2] Forming out of a tropical low on 17 April 1989, Orson gradually intensified as it tracked towards the west. After attaining Category 5 intensity on 20 April, the storm began to track southward and accelerated. The following day, the cyclone reached its peak intensity with winds of 250 km/h (160 mph) (10-minute sustained) and a barometric pressure of 904 hPa (mbar).[1] Orson maintained this intensity for nearly two days before making landfall near Dampier. The cyclone rapidly weakened after landfall as it accelerated to the southeast. After moving into the Great Australian Bight on 24 April, the storm dissipated.
Despite Orson's extreme intensity, damage was relatively minimal as it struck a sparsely populated region of Western Australia. Five people were killed offshore and damages amounted to A$20 million (US$16.8 million). The storm damaged a new gas platform, delaying the project for nearly two weeks. The most severe impacts took place in Pannawonica, where 70 homes were damaged. Following the storm, cleanup costs reached A$5 million (US$4.1 million). Due to the severity of the storm, the name Orson was retired after the season.
Cyclone Orson originated out of a tropical low, monitored by the Australian Bureau of Meteorology, that formed northwest of Darwin, Northern Territory on 17 April 1989. The system tracked southwest throughout the day before turning due west and strengthening into a tropical cyclone, at which time it received the name Orson.[3] At this time, the Joint Typhoon Warning Center (JTWC) also began monitoring the storm as Tropical Storm 28S.[4] The forward motion of the storm gradually slowed as it intensified and on 19 April, Orson attained Category 3 status on the Australian tropical cyclone intensity scale, classifying Orson as a severe tropical cyclone.[2] Later that day, as the storm attained Category 4 status, an eye developed. By this time, Orson began to turn towards the southwest and on 20 April,[3] the storm intensified into a Category 5 cyclone with winds of 210 km/h (130 mph) (10-minute sustained).[2]
The JTWC also reported significant strengthening during the same period. They assessed Orson to have attained an intensity equivalent to a Category 5 hurricane on the Saffir–Simpson hurricane scale on 22 April with winds of 260 km/h (160 mph) 1-minute sustained).[4] Around this time, the storm tracked directly over the North Rankin gas platform. The platform was in the 40 km (25 mi) wide eye of Orson for roughly 40 minutes.[5] A weather station there recorded a barometric pressure of 904 hPa (mbar; 26.69 inHg)[1] and wind gusts of 250 km/h (160 mph) before the station was damaged. This was, at the time, the lowest pressure ever recorded in the Australian region since records began.[5] It was later surpassed by Severe Tropical Cyclone Gwenda in 1999 when that storm attained a pressure of 900 hPa (mbar).[6] By this time, Cyclone Orson was roughly 555 km (345 mi) in diameter.[7]
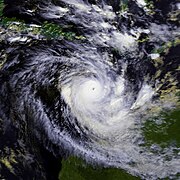
Cyclone Orson intensifying on 21 April
Continuing on a southerly track, accelerating ahead of an approaching cold front, Cyclone Orson made landfall, near Dampier, around 4:45 am AWST on 23 April (2045 UTC 22 April).[5] with winds of 220 km/h (140 mph) (10-minute sustained).[2] The JTWC also reported that Orson had weakened, with winds at landfall estimated at 230 km/h (140 mph) 1-minute sustained).[8] Tracking at 28 km/h (17 mph), the weakening storm passed over Pannawonica.[5] Less than 12 hours after landfall, the storm weakened below Category 3 status.[2] By this time, the JTWC was no longer monitoring the system.[8] Around 5:00 am AWST on 24 April (2100 UTC 23 April), Orson weakened to a tropical low while situated over southern Western Australia.[2] Continuing to accelerate to nearly 50 km/h (31 mph), the remnants of the storm moved over the Great Australian Bight late on 24 April.[3] Several hours after moving back over water, the storm dissipated.[5]
The Australian Bureau of Meteorology uses 10-minute sustained winds, while the Joint Typhoon Warning Center uses one-minute sustained winds.[9] The conversion factor between the two is 1.14.[10] The Bureau of Meteorology's peak intensity for Orson was 250 km/h (160 mph) 10-minute sustained, or 290 km/h (180 mph) one-minute sustained.[2][10] The JTWC's peak intensity for Orson was 260 km/h (160 mph) one-minute sustained, or 220 km/h (140 mph) 10-minute sustained.[8][10]
As Cyclone Orson approached the coast of Western Australia, residents were urged to prepare for the storm; people proceeded to clean up litter, secure outdoor items and make sure their disaster kits were stocked. All 200 personnel from a A$1.5 billion gas platform off the coast were evacuated ahead of the storm.[12] Since Cyclone Orson made landfall in a sparsely populated region, its effects were relatively light compared to its intensity.[3] More than 20 fishermen were reported missing during the storm.[13]
On 23 April, a rescue mission with three aircraft recovered roughly 20 fisherman, while one was still missing.[13] Offshore, the storm killed four Indonesian fishermen after their ships sank in swells up to 20 m (66 ft) produced by the storm.[3] The North Rankin gas platform sustained minor damage despite wind gusts reaching 270 km/h (170 mph)[14] and waves estimated at 21 m (69 ft).[15] The large swells also delayed the find of a major oil field that contained more than 200 million barrels (32,000,000 m3) of oil. The waves knocked a drill rig used to find oil out of position; it would take several days for the drill rig to be repositioned.[16] After an assessment of damage, it was found that the drill rig snapped off and broke the chains of two anchors before drifting nearly 2 km (1.2 mi) from the platform. The repositioning and cleanup of the drill rig delayed the project by nearly two weeks.[17] The damages from Cyclone Orson increased the total cost of the platform to roughly A$20 million (US$16.8 million).[18]
Upon making landfall, Orson produced a storm surge of 3.1 m (10 ft).[5] This came during low tide, having a height of 1.6 m (5.2 ft).[3] Severe erosion was recorded along coastal areas, some losing nearly 20 m (66 ft) of rocks.[3][19] Wind gusts in Dampier reached 183 km/h (114 mph) and a station near where Orson made landfall recorded a wind gust of 211 km/h (131 mph).[5] Harbour officials stated that several ships were knocked off their moorings and washed up onshore.[19] In Karratha, the local weather radar sustained roughly A$900,000 (US$760,000) in damages.[12] A nearby airport was also damaged.[19] The jetty at Point Samson was severely damaged and eventually removed.[20]
The most severe damage took place in the mining town of Pannawonica, where 70 homes were damaged by the storm. Numerous trees and power lines were downed along the storm's path. Before dissipating, the storm left one additional person missing after contact was lost with his yacht.[19] Later reports confirmed that the missing person drowned during the storm.[21] Twenty people were also injured during the storm, 60 were left homeless and about 1,000 were affected.[22] Total damages from the storm were estimated at A$20 million (US$16.8 million) and repair costs reached A$5 million (US$4.1 million).[3][23] Due to the severity of the storm, the name Orson was retired after the season.[24]
Cyclone Ilsa (2023) – another powerful tropical cyclone which took a similar path to Orson.
References
^ abcBuchan, S.J.; Tron, S.M.; Lemm A.J. (4 September 2002). Measured Tropical Cyclone Seas(PDF). 7th International Workshop on Wave hindcasting and forecasting preprints. Banff, Alberta, Canada. Archived (PDF) from the original on 21 September 2018. Retrieved 12 April 2012.
^ abcdefg"Australian Region Tropical Cyclone Best Tracks". Bureau of Meteorology. 2008. Retrieved 6 August 2009.
^ abcdefghHanstrum, B.; Foley, G (1992). Report on Tropical Cyclone Orson (PDF) (Report). Australian Bureau of Meteorology. Archived (PDF) from the original on 20 March 2012. Retrieved 12 April 2012.
^ abJoint Typhoon Warning Center, Naval Western Oceanography Center (1990). 1989 Annual Tropical Cyclone Report (PDF) (Report). United States Navy, United States Air force. Archived from the original (PDF) on 6 June 2011. Retrieved 6 August 2009.
^ abcdefgDrosdowsky L.; Woodcock F. (March 1991). "The South Pacific and southeast Indian Ocean tropical cyclone season 1988–89" (PDF). Australian Bureau of Meteorology. Retrieved 6 August 2009.
^Perth Tropical Cyclone Warning Centre (29 April 2009). Severe Tropical Cyclone Gwenda (PDF) (Report). Australian Bureau of Meteorology. Retrieved 12 April 2012.
^Zhang, Q.P.; Lai, L.L.; Sun, W.C. (2006). "Location of Tropical Cyclone Center with Intelligent Image Processing Technique". Advances in Machine Learning and Cybernetics. Lecture Notes in Computer Science. Vol. 3930. Springer Berlin/Heidelberg. pp. 898–907. doi:10.1007/11739685_94. ISBN 978-3-540-33584-9. Retrieved 7 August 2009.
^ abc"Tropical Cyclone 28S (Orson) Best Track". Joint Typhoon Warning Center, Naval Western Oceanography Center. United States Navy, United States Airforce. 2002. Archived from the original on 4 October 2013. Retrieved 6 August 2009.
^Joint Typhoon Warning Center (17 June 2011). "Frequently Asked Questions". United States Navy, United States Air force. Archived from the original on 1 September 2013. Retrieved 12 April 2012.
^ abc"Section 2 Intensity Observation and Forecast Errors". United States Navy. 2009. Archived from the original on 30 August 2012. Retrieved 6 August 2009.
^"Australian Tropical Cyclone Database" (CSV). Australian Bureau of Meteorology. 30 June 2023. Retrieved 30 June 2023. A guide on how to read the database is available here.
^ ab"West Stays On Alert As Cyclone Tracks Inland". Courier-Mail. 24 April 1989. (Accessed via Lexis-Nexis)
^ ab"Search and Rescue Finds 20 Fishermen". Sunday Tasmanian. 23 April 1989.
^Fahey, Martin (2005). "North Rankin 'A' Platform, North West Shelf". The University of Western Australia. Archived from the original on 13 September 2009. Retrieved 6 August 2009.
^Christopher C. Burt and Mark Stroud Extreme Weather p. 219
^"Cyclone Delays News of 'Major Oil Find'". Sydney Morning Herald. 25 April 1989. p. 23.
^Luker, Paul (9 May 1989). "Woodside faces further delay in WA oil tests". The Age. Retrieved 7 August 2009.
^Hextall, Bruce (16 May 1989). "First Shelf gas shipment to Japan likely in July". The Sydney Morning Herald. Retrieved 7 August 2009.
^ abcd"Cyclone Orson Was Nation's Strongest Ever". Holbart Mercury. 25 April 1989. (Accessed via Lexis-Nexis)
^"Point Samson". Karratha and Districts Tourist Information Centre. 2009. Archived from the original on 31 January 2012. Retrieved 13 December 2011. (Accessed via Lexis-Nexis)
^"Cyclone Death". Sydney Morning Herald. 23 April 1989. (Accessed via Lexis-Nexis)
^"North-western coast, WA: Cyclone". Australian Emergency Management Agency. 13 September 2006. Archived from the original on 26 April 2012. Retrieved 13 December 2011.
^"Cyclone Orson's bill may top $20M". Courier-Mail. 25 April 1989. (Accessed via Lexis-Nexis)
^RA V Tropical Cyclone Committee (2008). "Tropical Cyclone Operational Plan for the South Pacific and South-East Indian Ocean" (PDF). World Meteorological Organization. Retrieved 6 August 2009.
External links
Wikimedia Commons has media related to Cyclone Orson.
Track of Cyclone Orson (provided by Australia Severe Weather)


 Extratropical cyclone, remnant low, tropical disturbance, or monsoon depression